
Read Buenos Aires weather through the monthly climate
Buenos Aires weather is easier to plan around when temperatures and rainfall are read together. The table on this page uses the SMN normal period of 1991 to 2020 for Buenos Aires Observatorio, published in 2023. It presents mean daily maximums, mean daily minimums and mean monthly rainfall. These describe a long-term pattern at the named station, rather than conditions at a particular airport or on a booked date.
Use the figures to prepare clothing and decide how much outdoor time to build into your stay. Then consult a current forecast for the actual days. The best time to visit guide turns the seasonal differences into a choice between travel periods; this page explains the monthly values and how to interpret their limits.
Monthly temperatures and rainfall
Read across each row rather than selecting only the warmest-looking figure. The maximum and minimum columns summarise different parts of the daily temperature cycle. The rainfall column gives a monthly total averaged across the normal period. It is a separate measure: a warmer month can still have rainfall, and a lower monthly total leaves the timing of rainfall open.
The station matters when making comparisons. This is the Buenos Aires Observatorio series throughout, with the same normal period for all months. Keep that identity alongside the numbers if using them for your itinerary. The table is intended to compare the seasonal background consistently, so its values should not be relabelled as airport observations or a live forecast.
| Month | Mean daily maximum °C | Mean daily minimum °C | Mean monthly rainfall mm |
|---|---|---|---|
| January | 30.1 | 20.2 | 134.4 |
| February | 28.9 | 19.4 | 129.3 |
| March | 27.0 | 17.7 | 120.0 |
| April | 23.2 | 14.1 | 130.3 |
| May | 19.4 | 11.1 | 93.5 |
| June | 16.4 | 8.4 | 61.5 |
| July | 15.5 | 7.5 | 74.4 |
| August | 17.9 | 8.9 | 70.3 |
| September | 19.7 | 10.6 | 80.6 |
| October | 22.6 | 13.4 | 122.9 |
| November | 26.0 | 16.1 | 117.6 |
| December | 29.0 | 18.5 | 122.8 |
An outdoor city ride
A guided bike ride offers time outdoors when conditions suit your plans.
Hand-picked tours, booked through Viator. Prices are indicative starting prices in US dollars (as of November 2026). Tap a tour for live availability and the current price in your currency.
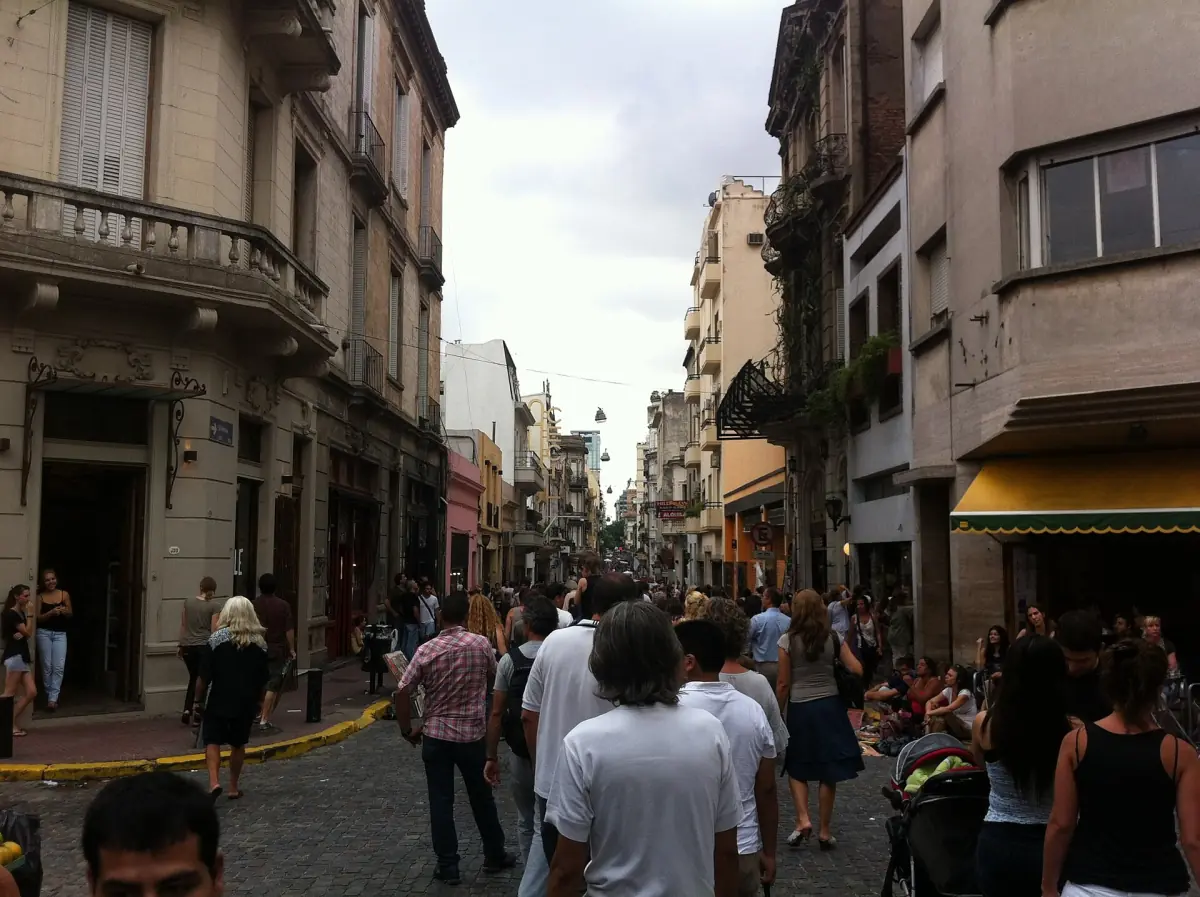
A guided cycle ride for an outdoor day
A city bike outing includes a cruiser bike, helmet, guide and bottled water; choose the date with the actual weather in mind.
What the maximum and minimum mean
The daily maximum column is an average of daily highs, not a record temperature or a ceiling for the month. Similarly, the daily minimum is an average of daily lows. The difference is useful when packing for both daytime activity and time outside later in the day. Neither column sets a guaranteed range for your visit.
January is the warmest month and July the coolest in this series. That gives a broad picture of the annual temperature pattern. For a walking-heavy itinerary, compare the milder months as well as the warmest ones. Choose according to your own comfort, then use the forecast to decide what to carry on each outing.
Rainfall totals and the limits of a monthly average
Every month in the normal series has rainfall. June has the lowest mean monthly total in the table, but the figure remains a climate average. A monthly sum does not specify which days will be wet, when showers will fall or whether a booked activity will run. Keep those questions separate from the choice of travel month.
Plan an alternative indoor interest alongside time outdoors so the daily itinerary can respond to conditions. For example, read about tango performances when deciding on an evening, and keep unbooked walking time flexible. Consult the current forecast close to the date; use climate values for the wider seasonal decision.
A cycle tour is an outdoor choice
The bike outing associated with this page lasts 4 hours. Its inclusions cover cruiser bikes, helmets, experienced multilingual guides, medical assistance and a bottle of water per person. The meeting point is beside the General San Martín equestrian monument in Plaza San Martín, in Retiro. Those details help place the activity in the day’s plan.
Choose it because you want a guided ride, and assess the date using current conditions and the booking terms. Read the bike tours guide for a fuller activity comparison. Use the climate table to prepare for time outside, and consult current conditions and booking arrangements for the specific departure.
Use climate and forecasts for different decisions
Before choosing dates, compare the monthly temperature pattern with how you want to spend your time. Before packing, consider both the warmer and cooler parts of the day. Shortly before an outdoor outing, turn to the current forecast and the arrangements for that activity. Each step answers a different practical question without asking a climate normal to predict an individual day.
Keep fixed bookings visible when arranging the surrounding free time. An adaptable programme allows you to move an unbooked walk while retaining a performance or another timed activity. The city sights guide can help identify interests for that flexible time. Use the table as a consistent background to these choices, and let the actual conditions shape the final schedule.
Questions about the climate table
Is this the forecast for my trip?
This is the SMN climate normal for 1991 to 2020, published in 2023. Use a current forecast for the dates of your stay and for decisions about an outdoor outing.
Which station supplies these values?
The table uses Buenos Aires Observatorio for every month. Its values should be read as that station’s climate series, with the normal period kept alongside the figures.
Does the lowest rainfall month guarantee dry days?
June has the lowest mean monthly rainfall in this series. A lower total does not specify the weather on individual days, so keep outdoor planning flexible.